
In order to watch this solution you need to have a subscription.
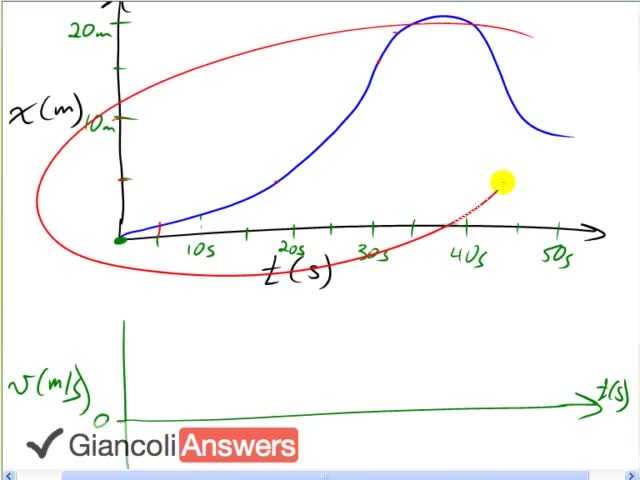
I’m going to make a sketch of the velocity versus time for this displacement versus time picture. We can plot a few key points to begin with: we know that at this particular peak point the slope of the tangent line is zero or it’s just about to turn around so it’s at the maximum position just before it starts to change direction and go backwards. This is a point where there is no velocity and so we’ll say that at that time we have zero velocity. So we can put a point on our velocity time graph there. We know that at this particular moment the position-time graph is the steepest right there and so that is going to be when our maximum occurs in the velocity-time graph so right there we want the highest point on the velocity-time graph. Then we know that at this time here it’s almost zero again but it’s still a bit negative because the slope is in the negative direction down to the right and so we’ll have a bit of a negative point there to line up with this time. And this is fairly steep here as well and so it will be almost as low as this point is high, almost but not quite and it will be negative though, so you have another point there. And we know that during this first bit of time the graph is practically straight and so our velocity time graph is going to be constant or it’s going to horizontal to the velocity slope of this position-time graph is not changing. And so the velocity will be a constant horizontal line for the first little while until it gets to this inflection point it seems to be about there somewhere, and then the velocity time graph will go up because of the steepness in the position time graph is increasing. So we’ll go upwards until we get to this point. That’s our maximum, we’re right here at the moment and then the position-time graph curves at that time and then it starts to slow down and so the velocity time graph is going to go down until we get to the peak of our position time graph and then we go negative velocity and then back up to about slightly negative at this time. If you wanted to put some numbers on here, in our previous question we did figure out that during this first moment of time, it’s about zero point two eight meters per second. But the numbers aren’t the important thing is to understand how the shape of this graph should result from this picture here.