An object starts from rest and falls under the influence of gravity. Draw graphs of
- its speed and
- the distance it has fallen, as a function of time from to . Ignore air resistance.

In order to watch this solution you need to have a subscription.
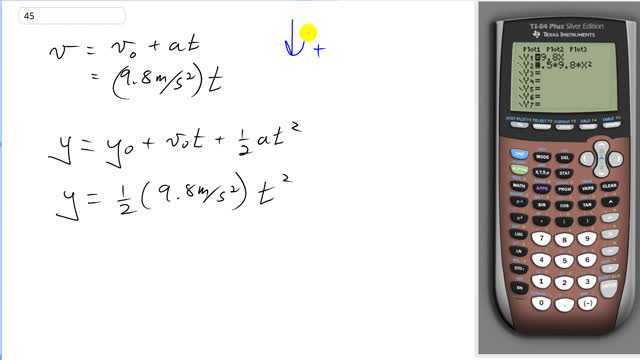
This is Giancoli Answers with Mr. Dychko. The speed this object will reach is given by final speed equals initial speed plus acceleration times time. We'll take downward direction to be positive although it's kind of not needed because we are just dealing with speeds here and everything is all in the same direction—downwards. So it's dropped from rest so the initial speed is zero and we have the acceleration then is just that due to gravity so 9.8 meters per second squared times the variable time. So over here in the graphing calculator which we should turn on we have y 1 is gonna be our speed formula and I have got the window settings from 0 up to 5 because it's from time 0 to 5 seconds and I know that the maximum speed is gonna be about 10 times 5 which is 50 so that's why I have y max at 50 and y min 0. This is a graph of a straight line through the origins so I know it's gonna have it's gonna start at x equals 0 and y equals 0 and then take a look at what that looks like there it is, there's the graph of speed versus time and its speed is increasing linearly with time you say because anytime you have a straight line, it's called linear and then we can return to our formulas here and I have the formula for the distance traveled lined up here and I'll press enter on the equal sign to engage this formula so it's gonna plot that one too now; I have also gone over here and changed its pattern so that it's well, let's make it a bold line and see how that looks and we'll also change the window settings to be about well this is a formula for distance, we need a window settings of about t squared's that's 5 squared is 25 and 25 times about 10 is 250 it's gonna go up to about 250 meters here on this graph and we can keep the other things the same and see what that looks like; that's the speed formula first and then we have the distance formula oh, times by half by the way, oh not 250 then that's gonna be 125 and then we'll look at that. And the distance is a parabola that curve is a parabola it's a graph of y equals some variable squared and yeah I guess, that's all it is asking for; there we go.
