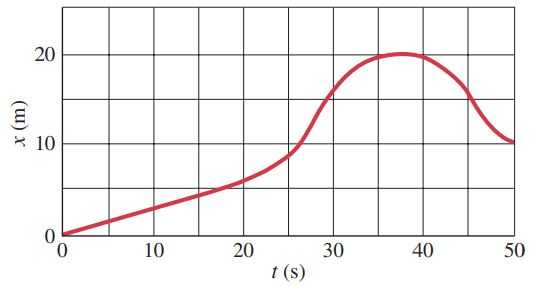
The position of a rabbit along a straight tunnel as a function of time is plotted in Fig. 2-44. What is its instantaneous velocity
- at and
- at ?
- between and ,
- between and , and
- between and ?


In order to watch this solution you need to have a subscription.
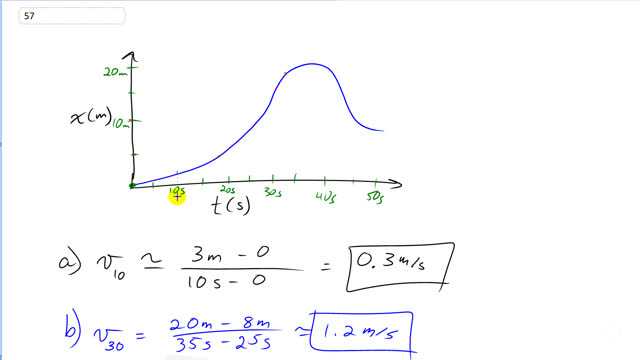
This is Giancoli Answers with Mr. Dychko. To find the instantaneous velocity on a position versus time graph, we have to find the tangent to the graph at the particular time of interest. So for the 10 second mark, we have a tangent that looks like this approximately and we have to find the slope of this line now. So it looks like it goes through the origin and looks like it's at about 3 meters say when it's at 10 seconds so we are finding the difference in change in y over the change in x, which in this context, is the change in position divided by the change in time. So its final position is 3 minus the initial position of 0 and the final time of 10 minus the initial time of 0 and that gives about 0.3 meters per second. And at 30 seconds, the tangent line looks like about this say so we have to find the slope of that more or less—I'm not the perfect drawer but you get the idea— and we have to choose any points on this tangent line that look convenient for calculating a slope and from about 35 seconds, it has a position of about 20 meters there and then subtract the corresponding stuff for the initial time of 25 seconds, it looks like it's about at 25 seconds, it looks like it's about 8 meters so we have 20 final height minus 8 for the initial height of this line and divided by 35 seconds minus 25 seconds so about 1.2 meters per second looks like is the slope of this tangent line at 30 seconds. For part (c), the average velocity is not a tangent anymore instead it's just a line connecting the final and the initial points and that line could be any line; it doesn't have to be a tangent that just touches the graph at, you know, sort of one point but in the case of at 5 seconds, between 0 and 5 seconds, the slope is constant and it's gonna equal the slope of this tangent at 10 seconds and so the answer for part (c) will be the same as part (a)— 0.3 meters per second. And for part (d), between 25 and 30 seconds, let's take a look at that; let's get rid of some of these other lines that are in the way. Between 25 and 30, it looks like it starts at about well, let's put some lines up here here's 30 and here's 25 and looks like it's about 16 to 9 so this line's up with about 16 meters and this line's with about 9 meters or so. So we have the final height of 16 minus the initial height of 9 that's the change in position and that divided by the change in time of 30 minus 25 gives about 1.4 meters per second and so that's the slope of this line here which is not a tangent at all and that's average velocity; average velocity is just change in position divided by change in time. And for this 10 second interval between 40 and 50 so that's 50 seconds minus 40 seconds, it looks like at 50 seconds it has a position of about 10 meters so at 50 seconds, position is about 10 meters and at 40 seconds, its position looks like its at about 19.5 if you wanna get pretend that you are being precise but more like 20 I guess but anyway, we'll put in 19.5 and then divide by the change in time of 50 minus 40, we get negative 0.95 meters per second and so that's the slope of this line it's from this point to here. That's the average velocity during that time interval from 40 to 50; it's a negative slope and the calculation reflects that negative 9.5.
